Power ON
Supercharge Power BI with Planning and Write-back
- Budgeting & planning
- Write-back
- Excel familiarity
- Seamless integration
"*" indicates required fields
Why do you need Planning and Write-back in Power BI?

Disconnected Planning Data and Tools
Enhance planning efficiency by avoiding disconnected tools. Siloed data, transparency issues, and prolonged planning cycles are risks. Optimize with Power BI: connect data, build dynamic models, and collaborate seamlessly for real-time results.

Can’t Get Beyond Data Visualization and Analysis
Unlock Power BI's potential. Elevate beyond visualization with write-back functionality. Tailor Power BI to your business's unique needs for maximum versatility and productivity.

Ungoverned Data With No Single Source of Truth
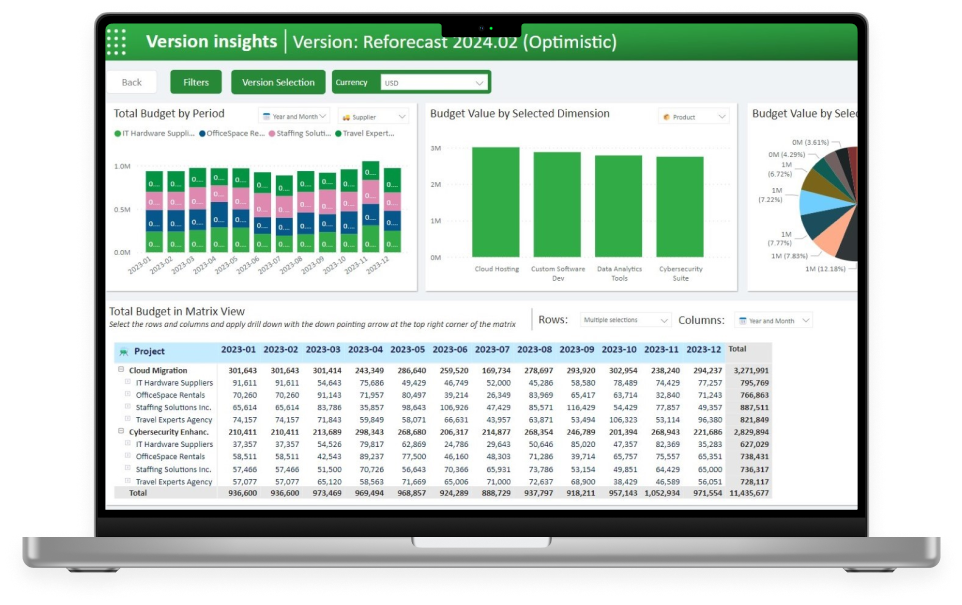
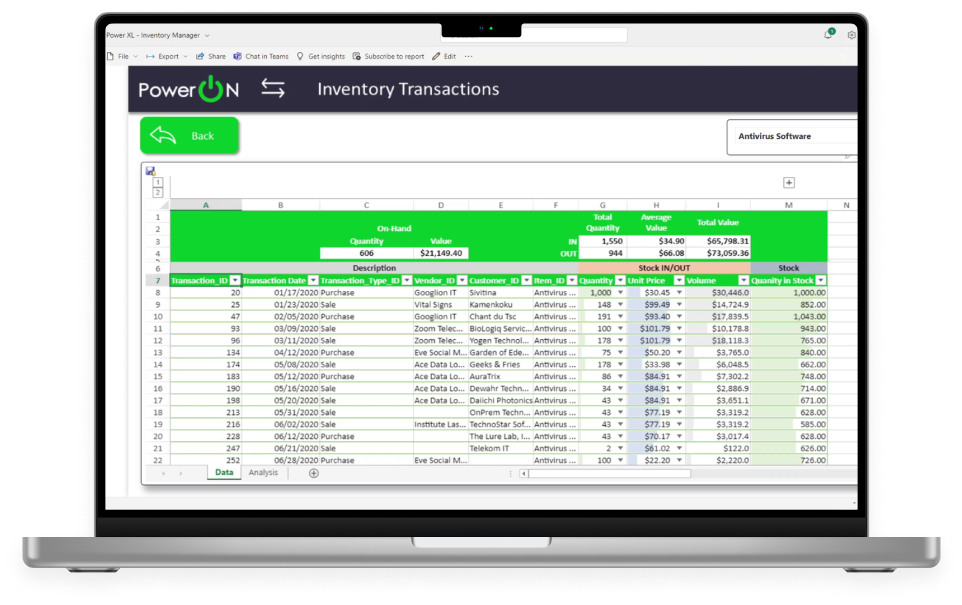
Capture your budget data centrally using Power BI – allow your users to seamlessly work with data in real-time in one familiar tool rather than in local, ungoverned spreadsheets. Store your data alongside actuals to enable easy variance analysis.
Unify and Enrich Data in Your Power BI
Maximize your Power BI investment with Power ON. Elevate your analytics to dynamic planning, forecasting, and real-time collaboration. Unify operational, sales, supply/demand, and production planning seamlessly within Power BI. Integrate driver-based modeling, what-if scenarios, workflows, AI/ML prediction, and custom visuals. Edit, comment, and filter with instantaneous updates and role-based security. Streamline data management with built-in Master Data Management. Empower your team to make confident decisions, all in one place – Power BI.
Break Down Silos for Agile Power BI Customization
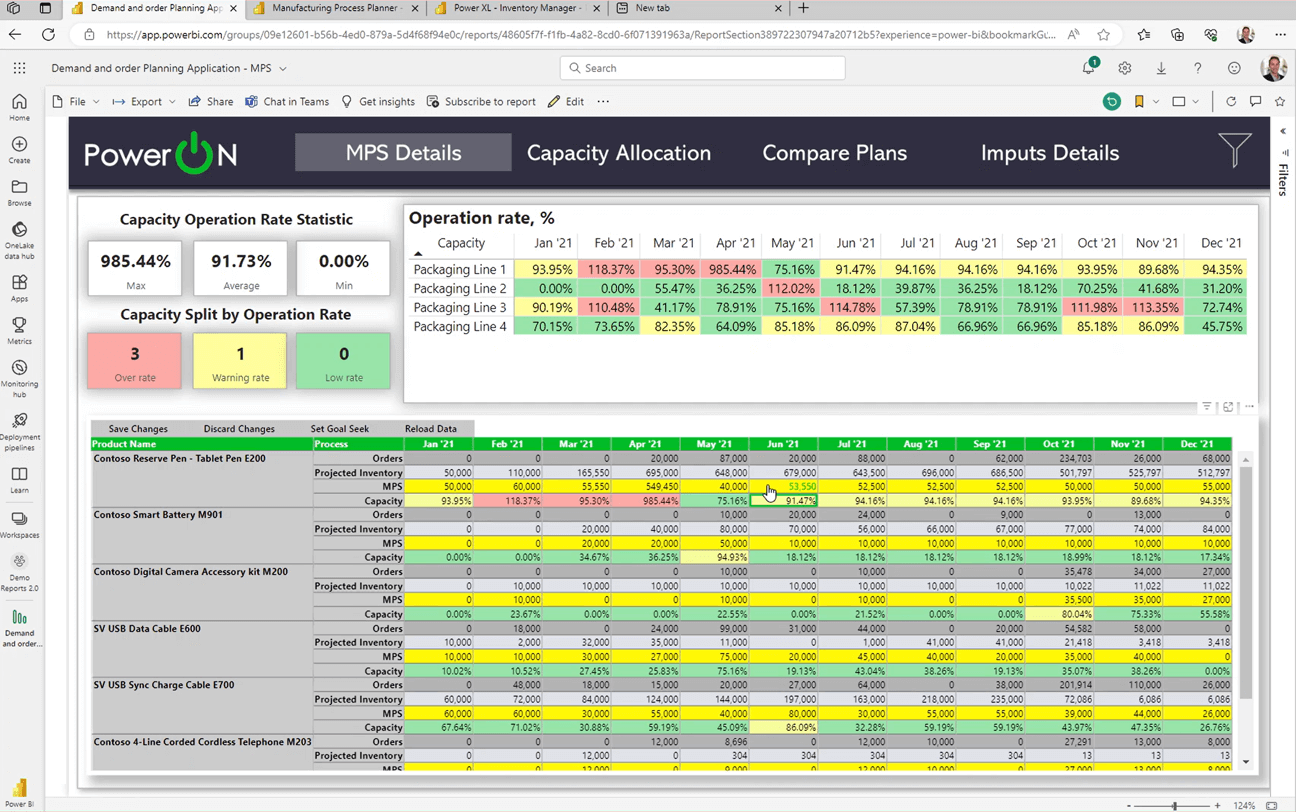
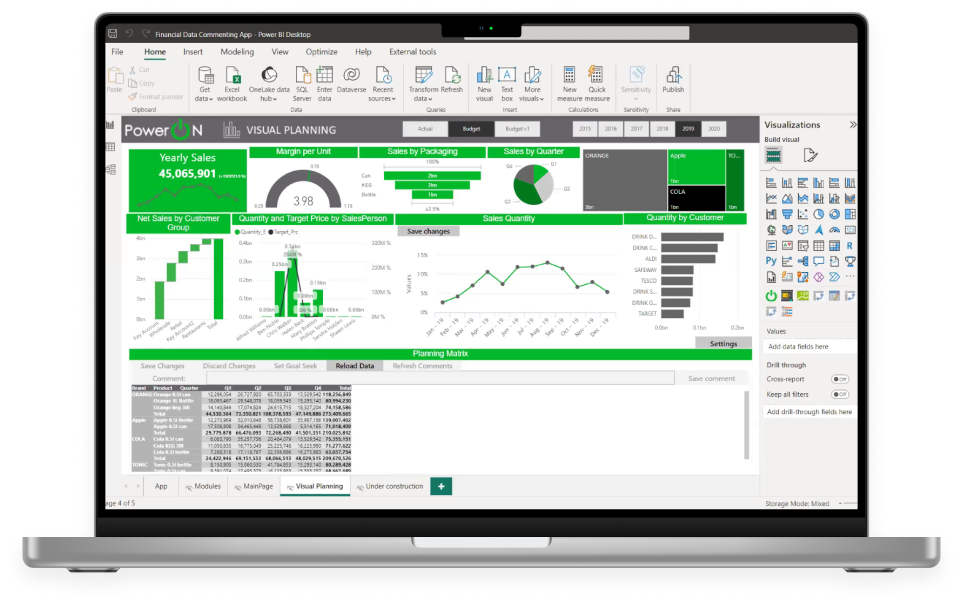
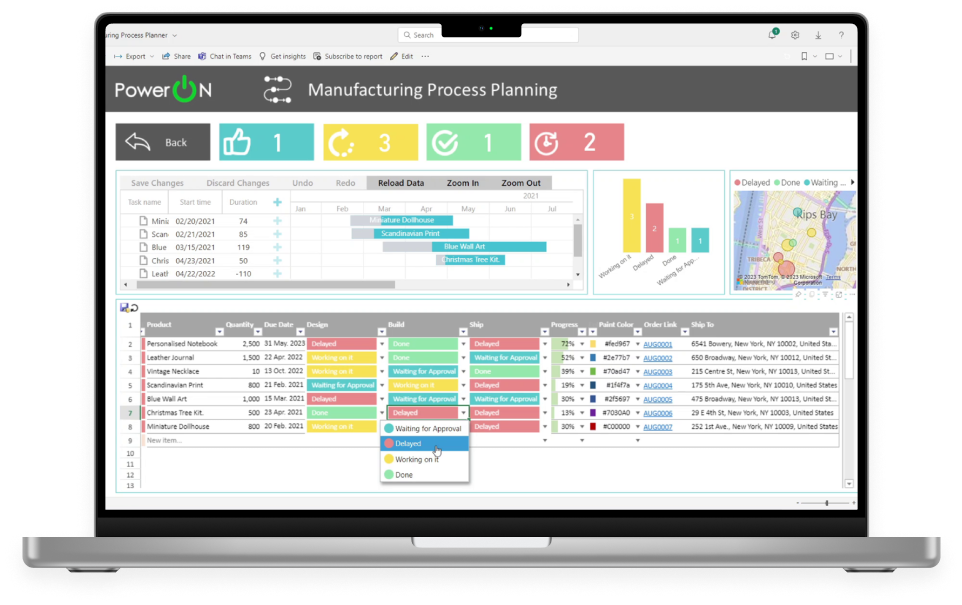
Optimize planning with Power BI’s write-back feature. Edit data in dashboards or reports, see real-time visual updates, and save changes to the source. Empower IT and analysts to create custom apps and reports without coding. Streamline data collection, make informed decisions by writing back to tabular models, and bypass complex databases or third-party tools.
Turn Power BI into a Versatile and Productive Business Tool
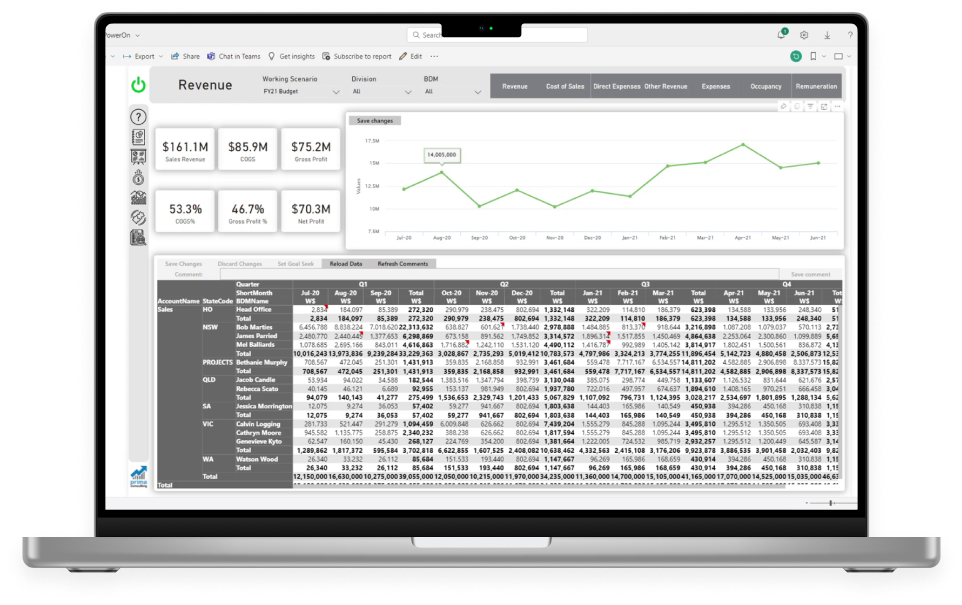
Maximize business user efficiency in Power BI with an Excel-like interface. Analyze, edit, filter, and format data seamlessly. Power ON’s planning software revolutionizes strategy with driver-based, top-down planning, and KPI goal-seeking features, facilitating data-driven decisions. Experience multi-version simulation, automated data imports, and seamless Power BI integration for efficient planning. Unleash your potential with comprehensive planning software today.
Meet Your Technology and Business Needs
Power ON solutions fit into your existing technology stack and embed seamlessly into the Power BI ecosystem. In the cloud, on-prem, or hybrid, Power ON leverages and respects your existing systems and security.
- Run in private or public Cloud
- Use it on-premises with Power BI Report Server
- House it in your own Azure tenant
- Works across disparate datasets; Composite models and hybrid tables
- Leverage advanced read-and-write rules
- Create user or group-based security rules
Maximize Functionality and Flexibility With How You Budget
Power ON’s Budget Planner is a complete budgeting and planning solution that helps organizations create unified and structured budgets within Power BI. Budget Planner is built on Power ON and delivers a pre-configured planning and budgeting model that gets you up and running fast, with Excel-like functionality for easy user adoption. Budget Planner allows users to perform impactful analysis on working budgets by easily inputting budget figures, making changes to existing budget versions, and providing shortcuts to copy and manipulate data.