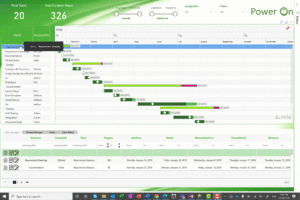
Modifying GANTT Charts inside Power BI

Power BI continues to Shock and Awe us all, month after month. In the December release of Power BI Desktop, I saw the GANTT chart and we had a use case to update task dates and descriptions on project plans for a client.
Background
After coming to America 3 years ago and learning DAX through Power Pivot Pro’s excellent intro to Tabular models, I met the founder of Power ON, Per Solli in Los Angeles in 2017. Power ON’s toolkit opens up completely new opportunity with their Power BI Write-Back Features, and their custom visuals. It is awesome, you should try it. Power ON’s Toolkit is it what enabled the write-back in this blog post.
Problem
Our client wanted the ability to plan over time, and a GANTT Chart is an excellent way to visualize tasks, add additional data and filter Power BI reports. The only problem, is that Power BI is READ-ONLY. However, Power ON’s technology makes ANYTHING WRITE-BACK.
Solution
After a couple of hours, I could store the data in a SQL Server and/or Tabular Server, and make the visual update dynamically.

This report has two main components:
- The xViz GANTT Chart
- Power ON’s Table Editor
In Power BI now turns into a powerful planning tool:
- Filter and view tasks on any attribute in the report
- Expand and Collapse the Tasks
- UPDATE Tasks, People and Dates.
In this case we expanded ‘Prototyping’ with one month.
The GANTT Chart Wizard is courtesy of xViz. You can find more info on this site about the write-back technologies.