Massive Gains in Business Agility with Reduced Time to Generate Reports, Collaborative Dashboards, and Automatic KPI Calculation

About Mater
Established in 1906 with a single not-for-profit hospital, today Mater delivers care and compassion for the sick and needy across an extensive and growing network of 12 hospitals and health centres, as well as education programs and a world-class research institute. Continually striving for excellence, Mater’s Clinical Governance team implemented Power ON to streamline monthly reporting to management and the Board and allow for the unique ability to add commentary within Power BI – turning KPIs from “just a number” into the story of the patient.
THE CHALLENGE
The Clinical Governance team works with all areas of the business to ensure the highest standard of patient safety across Mater hospitals. A key element of its work involves monthly report creation for hospital management and the Board.
Reporting involved data collection across 12 hospital sites and nine regional groups, culminating in 100s of KPIs and associated comments that had to be manually updated every month. Mater used Power BI for collaborative analysis, but Power BI’s limitation of not supporting commentary forced many manual steps to achieve a final monthly report.
The initial data collection, as in many organizations, relied heavily on Excel spreadsheets. Participants then recorded figures into a central repository. Data was further aggregated and manipulated in Excel, where charts were added. The final report was built in Microsoft Word to allow for the critical KPI commentary to be added.
The Importance of Comments in Power BI
Behind the actual numbers in KPIs, lies each patient’s story. Commentary associated with each KPI provides context to management and the Board to ensure focus and that choices are made for the betterment of patients. Commentary can highlight successful initiatives to be expanded upon or draw focus to areas in need of improvements. Commentary is critical and a valuable tool in helping achieve Mater’s goal of delivering the highest standard of patient safety on a consistent basis. The monthly report creation process was time-consuming and required considerable coordination and oversight. Growing client demand and data volumes was stretching the existing manual process to the limit. Mater knew there had to be a better way and set out to find one.
BEFORE
- 10s to 100s of spreadsheets
- Manual report creation in Word to support “comments”
- 100s of KPIs manually calculated
- 4-week manual data and commentary consolidation across 3 companies, 12 hospitals and 9 geographical locations
- Disparate data source collation into static Word reports, with limited ability for further analysis
THE SOLUTION
Researching potential solutions to the “commentary and write-back limitation” in Power BI, the Clinical Governance Team at Mater found that Power ON Visual Table Editor addressed their many requirements – and then some.
With Power BI + Power ON they built a Power BI dashboard that allowed 12 hospitals and nine reporting groups to each have individual KPIs visuals that supported collaborative input across key stakeholders. Power ON also enabled them to add current and trend commentary that automatically consolidated into a unified database table for use across operational and Board reports; with the previous month’s trend commentary available for comparison and use in the current month’s evaluation for the first time.
The initial setup was relatively straightforward, with the bonus of having Prima Consulting, a local expert, to support implementation. With additional filtering capability and column look-up functionality, the potential to expand the number of analysis and reporting processes beyond the KPI commentary was a huge plus. With minimal training, the team was able to utilise the expanded abilities to capture KPI commentary in Power BI and set their new target benchmarks. User acceptance was quick as the operational advantages were clearly evident.
The Clinical Governance team now has more time to focus on their primary goals, implementing the highest standards of patient safety across the Mater Hospitals. ~ Mary Jane Capp, Quality and Safety Manager
THE RESULTS
Manual error-prone data collection in spreadsheets, chart creation and subsequent formatting in Word, has been replaced with automated, accurate, collaborative, and real-time data collection unified in Power BI + Power ON.
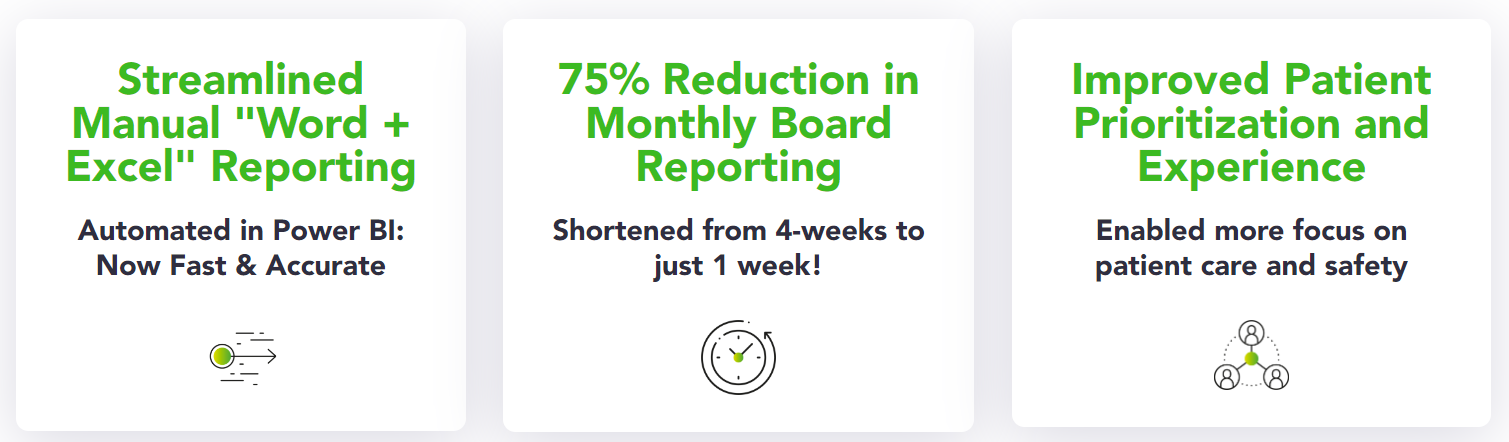
KPIs are now calculated automatically, reducing monthly report creation by 75% (from four weeks to just one), while enabling Clinical Governance staff to add meaningful commentary directly into the dashboard for real-time management use. Management and Board stakeholders now access and review KPIs, plus associated commentary, more quickly – enabling them to make more timely and wholly informed decisions that positively impact patient care. Oversight has also been, freeing regional users’ time to allocate to higher value work with more immediate patient impact.
Finally, the Clinical Governance staff now have more time to focus on their prime goal, implementing the highest standard of patient safety across Mater hospitals.
What’s next? With the success of PowerOn with writeback in Power BI in the reporting systems of the Clinical Governance team, further opportunities to leverage the writeback capability are currently being explored in other reporting areas, like hospital blood transfusion usage.
AFTER
- Unified monthly report data collection in Power BI (no more shuffling spreadsheets!)
- Automated and collaborative commentary collection in Power BI
- Automatic KPI calculation and consolidation in Power BI
- 75% reduction in monthly report creation (from 4 week to just 1 week)
- Real-time, interactive Dashboard in Power BI for further “what-if” analysis
With Power ON, we now have the ability to add meaningful commentary from frontline managers directly into the dashboard for real-time analysis and reporting.
Management and Board stakeholders can review KPIs, with associated commentary, to make more informed decisions and prioritise areas of focus that positively impact patient care.