Why & How to Upskill your Data Analytics skills

Providing valuable insights from data that moves the business forward in achieving its strategic objectives is one of the most valuable skills any FP&A or Operational Planning (OP) professional can possess.
Without big data analytics, companies are blind and deaf, wandering out onto the web like deer on a freeway.
~ Geoffrey Moore, Author and Consultant
Information is the oil of the 21st century, and analytics is the combustion engine.”
~ Peter Sondergaard, SVP & Global Head of Research, Gartner, Inc.
In God we trust. All others must bring data.”
~ W Edwards Deming, Statistician, Professor, Author, Lecturer, and Consultant
The above quotes highlight the ever-growing need to be comfortable working with and analyzing large datasets. The reality is the amount and complexity of the data one works with is only increasing, and to keep up, one must upskill oneself, and look to implement technology that can help manage today’s data.
Various Paths to Work with Data
Many different paths exist for learning to work with data. Learning to work with data involves developing the technical skills to manage large data sets and the soft skills to use storytelling, improving communication within the finance department and influencing to help audiences make data-informed decisions. In this article, we will focus on common technical skills/tools that can improve your confidence and capability to work with data. Some key technical skills/tools that help when working with data include:
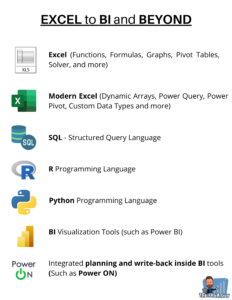
- Microsoft Excel
- Modern Excel (Dynamic Arrays, Power Query, Power Pivot)
- Programming/Scripting languages
- Business Intelligence tools (like Power BI)
In the following sections review each skill and the benefits of learning said skill.
1. Excel
In the above list, Excel is separated from “Modern Excel”. “Modern Excel” is a term some people use to describe all the new capabilities Microsoft has added over the last decade. Many Excel users are NOT familiar with or even using Modern Excel; a major missed opportunity in my experienced opinion. Read a job post, and it will often say something along the lines of “advanced Excel skills required” and then list some combination of (Vlookup, Index/Match, SUMIFS, or Pivot Tables). The base skills you need to master to conduct analysis in Excel include:
- Modeling design principles
- Common functions and formulas
- Excel Tables
- Pivot Tables & Pivot Charts
- Charts & Graphs
Learning the above is an entry point and is the start of one’s journey working with and analyzing data. If you’ve already nailed these, great, you’re ready to add Modern Excel, a modern must-have, to your toolbox.
2. Modern Excel
After the basics of Excel, a natural progression for analysts is to learn the newer, and a bit more powerful features in Excel (aka Modern Excel):
- Power Query
- Power Pivot
- Dynamic Arrays
These newer features are designed to work with larger datasets and help one to start understanding the basics of data and data structure. Power Query is great for learning how to clean and transform data and Power Pivot provides you access to the Power BI data model to learn how to start creating and building self-service data models. The beauty of Modern Excel is two-fold.
- Provides the ability to work with datasets with millions and even tens of millions of rows
- Serves as a gateway to learning other tools such as Power BI, R, Python, and SQL
The more you progress down the analytics path, the more you realize that tools beyond Excel are critical in providing the planning and analytical support your business partners need.
3. Programming/Scripting Languages
The most common programming/scripting languages for finance and data people are SQL, R and Python.
- Structured Query Language (SQL) is great for pulling data out of a database
- R is a programming language that is primarily used for graphing and statistical analysis
- Python is the most common programming language in the world but has many libraries that are greater for quantitative analysis with large data sets
Learning these languages can be helpful in working with large datasets and for learning how to automate monthly tasks. Furthermore, these languages can be used in the Microsoft Power Stack directly through Microsoft or with various add-ins.
4. Business Intelligence Tools
Every company reaches the point where they need a business intelligence (BI) tool to help manage and visualize the data to support analysis and decision making.
When it comes to learning and working with BI tools many different tools exist. However, I have found that for most finance professionals, it is easiest to learn these skills with Power Pivot and then Power BI (PBI). This learning path allows for a natural progression from Excel to Modern Excel to Power BI.
Other benefits of learning Power BI include:
- Strong integration with Microsoft Excel
- Ability to use SQL, R, and Python within Power BI
- Ecosystem of add-ons available to expand its capabilities
- The self-service nature of Power BI allows you to build your own models and reports
While Power BI is a very powerful tool and one that can make visualizing and reporting on data easier, many analysts, including myself, very quickly identify one area that it is not equipped to handle out-of-the-box; financial and operational planning. Why? Because Power BI, like other BI tools, is by design meant for analysis. Performance Management (aka Planning tools) are for Planning. But, FP&A professionals have used Excel for analysis AND for planning, for decades. So why combine analysis and planning in a BI tool? It seems an obvious choice!
Which is why I was excited when I found out some integrated add-ins, are already part of the broad Power BI ecosystem, that do just that. These PBI ecosystem solutions (aka integrated add-ins) provide the benefit of allowing you to plan, analyze and manage data within one tool, your BI tool, vs splitting your effort between tools; one tool for company-wide data visualization and another tool for planning.
Operational & Financial Planning in Power BI
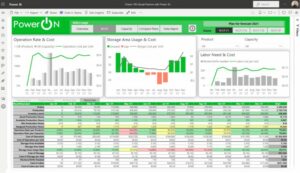
One tool that I feel can take Power BI to the next level is Power ON as it provides all the benefits of Power BI combined with the ability to do operational and financial planning thanks to its data entry, data-point comment, and write-back capabilities. With Power ON you get the power of real-time, collaborative data-collection, forecasting, commenting, and what-if scenario modeling all within Power BI.
You also have the ability to work in a spreadsheet like interface, which we’re all comfortable using, but now you can do it within Power BI. This was one thing I thought was especially helpful for us FP&A folks who know Excel like the back of our hand, want to learn and leverage the enhanced prowess of Power BI, but don’t want to have to deal with DAX. It’s basically as if you are working in Excel, but in Power BI. It might seem unbelievable, but don’t take my word for it. You can decide for yourself.
Power BI Visuals
One competitive feature that Microsoft added to Power BI in 2015 was the implementation of Custom Visuals. This enables third party vendors to add features at lightning speed to Power BI. Zebra, SQL BI, and 100’s of other partners have added valuable features to Power BI. This has significantly contributed to Power BI becoming the market leader in the BI space.
Power ON launched a new visual that marries Excel and Power BI; your Excel Features inside Power BI. This significantly lowers the bar for Business Analysts to invest time and effort into the Power BI eco-system compared to just staying in Excel.
 Conclusion
 Conclusion
Learning to improve one’s technical skills is a worthwhile journey. As the data world becomes more complex it is going to become more important than ever before that we analysts (Financial and Business Analysts) have more than “Just Excel” in our tech stack and toolbelt for working with and managing data. A great place to start is with Microsoft tech tool stack going from Excel to Power BI and beyond.
If you are interested in learning how to take your BI tool skills to the next level and enabling your people to Analyze, Enter Plans, even Manage Data, all in the same place than visit Power ON’s homepage to learn more.
~ Guest Author: Paul Barnhurst is an esteemed writer, podcaster and contributor in all things FP&A. You probably know him as “The FP&A guy”, For years, Paul Barnhurst has been a leader, influencer and educator in the FP&A community. Every day Paul posts actionable tips and advice from his career and daily learnings about FP&A. This ranges from budgeting, forecasting, financial planning, financial modeling, report building, and business partnering. Paul is a Finance Professional with 12+ years of finance and FP&A experience, having worked in several industries, including the US government, travel services, finance, automotive, Cyber Security, Ecommerce.
Until next time…
Power ON